What Is OHLCV Data? Meaning, Format and How to Get OHLC Data via API
What Is OHLCV Data? Meaning, Format and How to Get OHLC Data via API
If you have ever looked at a candlestick chart, run a backtest or calculated a moving average, you have used OHLCV data. It is the standard format for summarising market activity over a period of time, and almost every trading library, charting tool and machine-learning pipeline expects it.
OHLCV meaning
OHLCV stands for:
| Letter | Field | Meaning |
|---|---|---|
| O | Open | First traded price in the period |
| H | High | Highest traded price in the period |
| L | Low | Lowest traded price in the period |
| C | Close | Last traded price in the period |
| V | Volume | Total quantity traded in the period |
OHLC data is the same without volume - common for forex, where there is no single centralised exchange volume.
Each row represents one bar (also called a candle or K-line) for a fixed interval such as 1 minute, 1 hour or 1 day.
Example OHLCV table
| Time (UTC) | Open | High | Low | Close | Volume |
|---|---|---|---|---|---|
| 2026-10-26 | 230.10 | 233.45 | 229.80 | 232.90 | 51,203,400 |
| 2026-10-27 | 232.95 | 234.10 | 231.20 | 231.75 | 44,870,100 |
| 2026-10-28 | 231.60 | 236.00 | 231.10 | 235.40 | 58,112,900 |
Illustrative values.
From OHLCV to candlesticks
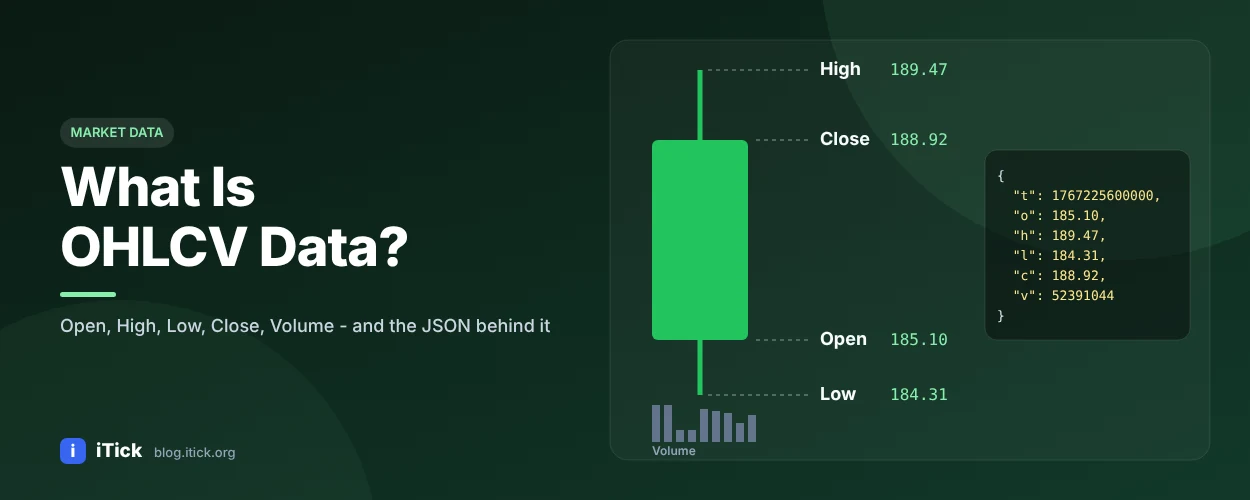
A candlestick visualises one OHLCV row:
- The body spans open to close - green/hollow if close > open, red/filled if close < open.
- The wicks (shadows) extend to the high and low.
- Volume is usually drawn as a histogram below the price chart.
Common OHLCV timeframes
- Intraday: 1, 5, 15, 30 and 60-minute bars for day trading and execution research.
- Daily: the most common timeframe for backtesting and screening.
- Weekly / monthly: long-term trend and portfolio analysis.
Bars are built from underlying tick data: every trade inside the interval updates the high, low, close and volume.
What OHLCV data is used for
- Calculating indicators such as EMA, RSI, MACD and ADX
- Backtesting trading strategies
- Volatility measures (ATR, true range) and risk models
- Feature engineering for machine-learning forecasts
- Rendering charts in trading apps and dashboards
Data quality pitfalls
- Time zones. Store timestamps in UTC and convert for display. iTick returns millisecond Unix timestamps.
- Missing bars. Holidays and illiquid periods create gaps; don't forward-fill them blindly.
- Corporate actions. Splits and dividends change historical prices - know whether your data is adjusted.
- Partial bars. The current, still-forming bar changes until the interval closes. Exclude it from backtests.
- Session definitions. A "daily" bar may include or exclude pre-market and after-hours trading.
How to download OHLCV data with an API
The iTick historical data API returns OHLCV bars for stocks, forex, crypto, indices, futures and funds in one consistent JSON format:
{"t": 1761609600000, "o": 231.60, "h": 236.00, "l": 231.10, "c": 235.40, "v": 58112900, "tu": 13612345678.0}
Fields: t timestamp (ms), o open, h high, l low, c close, v volume, tu turnover.
Python example: OHLCV to CSV
      import requests
import pandas as pd

TOKEN = "YOUR_API_TOKEN"
headers = {"accept": "application/json", "token": TOKEN}

def get_ohlcv(asset, region, code, ktype=8, limit=1000):
    url = f"https://api.itick.org/{asset}/kline"
    params = {"region": region, "code": code, "kType": ktype, "limit": limit}
    rows = requests.get(url, params=params, headers=headers, timeout=10).json()["data"]
    df = pd.DataFrame(rows).rename(columns={"t": "time", "o": "open", "h": "high",
                                            "l": "low", "c": "close", "v": "volume"})
    df["time"] = pd.to_datetime(df["time"], unit="ms", utc=True)
    return df.set_index("time").sort_index()

aapl = get_ohlcv("stock", "US", "AAPL")
eurusd = get_ohlcv("forex", "GB", "EURUSD")
btc = get_ohlcv("crypto", "BA", "BTCUSDT")

aapl.to_csv("AAPL_ohlcv.csv")
print(btc.tail())
Change kType to switch between minute, hourly, daily, weekly and monthly bars (see the docs for values), and use the et end-time parameter to page further back in history.
FAQ
What does OHLCV stand for? Open, High, Low, Close, Volume.
What is the difference between OHLC and OHLCV? OHLCV includes traded volume; OHLC does not.
Where can I get free OHLCV data? iTick offers a free API key with historical OHLCV for stocks, forex and crypto for personal use.
Is OHLCV the same as K-line data? Yes. "K-line" is the common term in Asian markets for candlestick (OHLCV) data.
Start with clean OHLCV data
Reliable OHLCV history is the foundation of every indicator and backtest. Get your free iTick API key and download years of candles for global markets in minutes.