Stock API
5 Best Stock APIs for Real-Time and Historical Prices
Compare 5 stock APIs for real-time & historical market data, including iTick, Alpha Vantage, Finnhub, Twelve Data and yfinance
Stock API
Compare 5 stock APIs for real-time & historical market data, including iTick, Alpha Vantage, Finnhub, Twelve Data and yfinance
Market Data
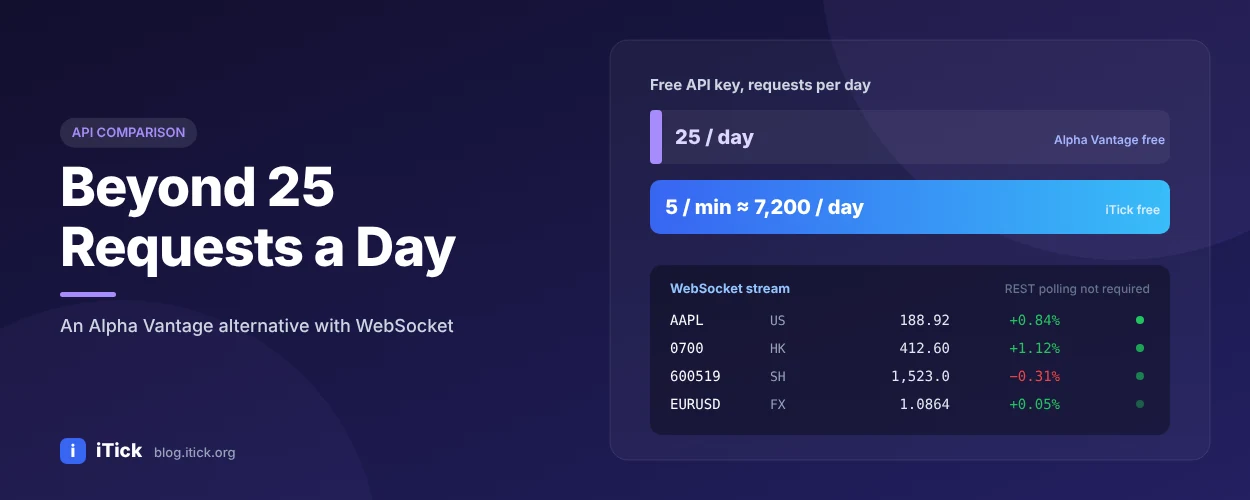
Alpha Vantage free API keys are limited to 25 requests per day. Compare Alpha Vantage pricing and limits with iTick, see when an Alpha Vantage alternative makes sense, and migrate GLOBAL_QUOTE, TIME_SERIES and FX calls with Python examples.
Technical Analysis
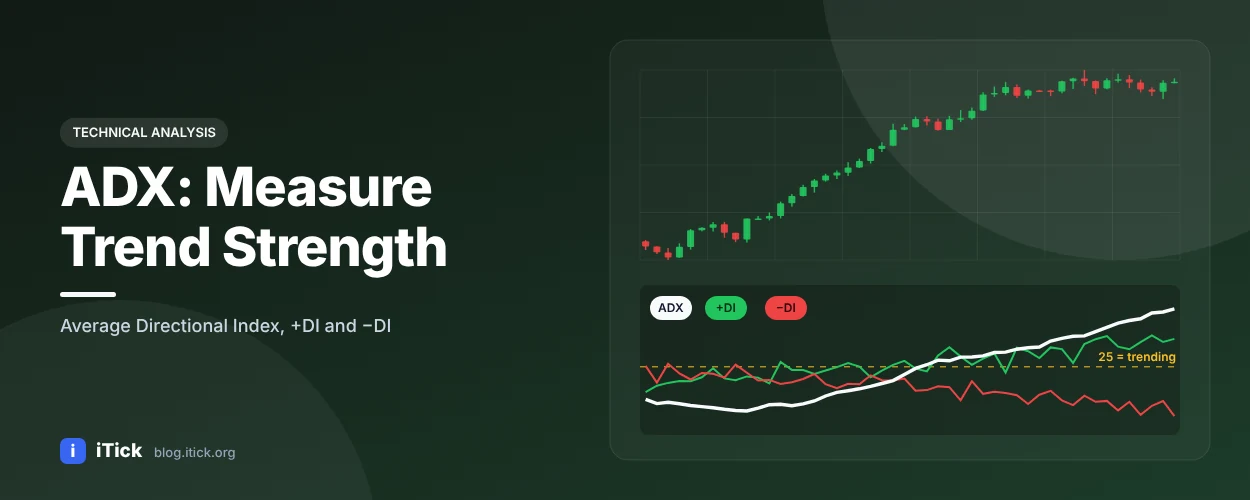
The Average Directional Index (ADX) explained: what ADX measures, how +DI, -DI and ADX are calculated with Wilder smoothing, how to read ADX values (20, 25, 40), common ADX trading strategies and a Python implementation using iTick market data.
Tutorial
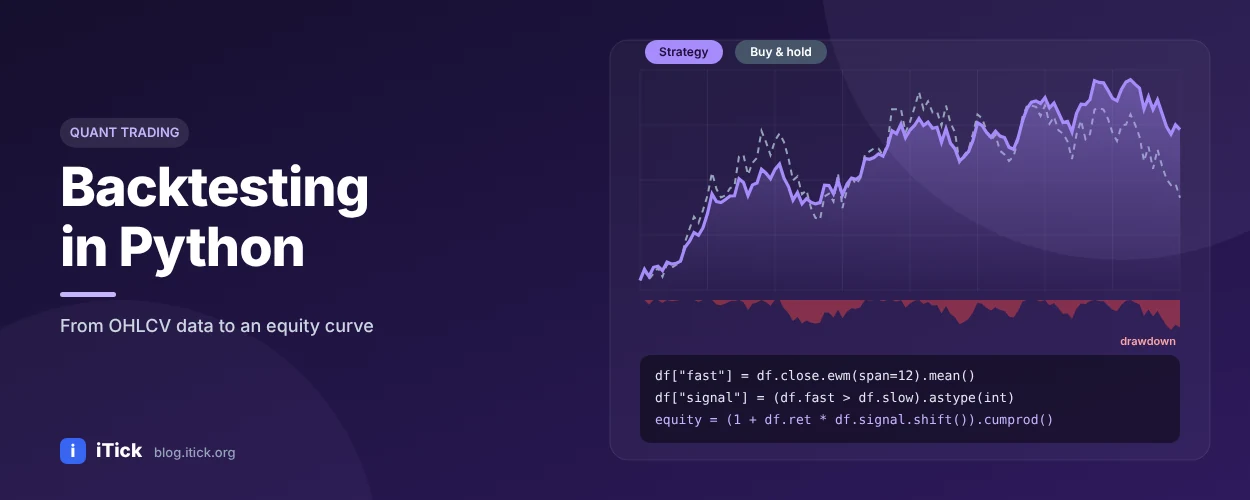
Learn backtesting in Python from scratch: download historical OHLCV data with the iTick API, build a vectorised EMA crossover backtest in pandas, add trading costs, compute CAGR, Sharpe ratio and max drawdown, and avoid look-ahead bias and overfitting.
Market Data
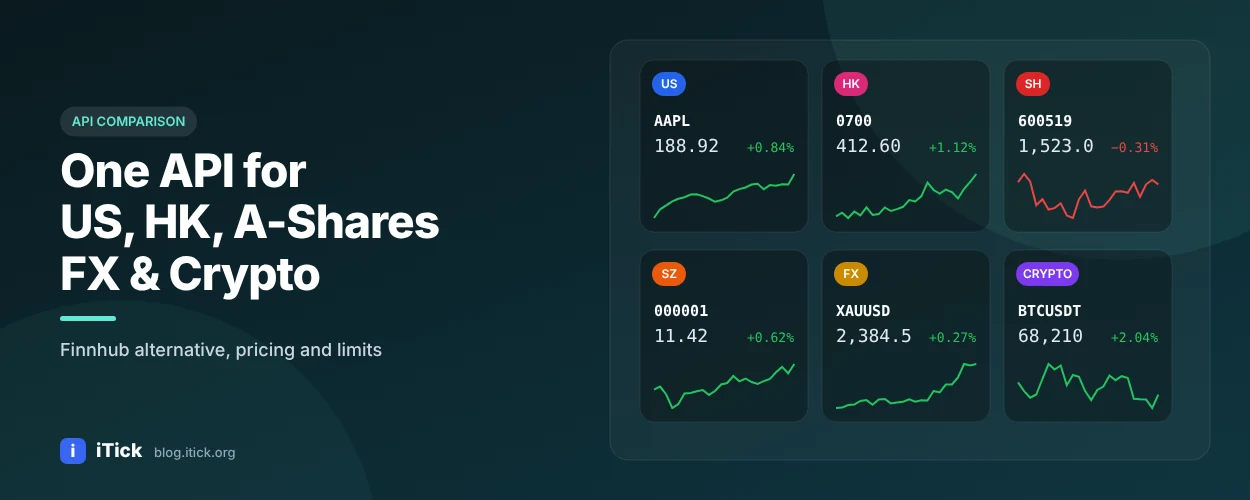
An honest look at the Finnhub API free tier (about 60 calls per minute, personal use), how Finnhub pricing works, Finnhub vs Polygon, and when iTick is the better Finnhub alternative for Hong Kong, China A-share, forex and crypto data.
Market Data
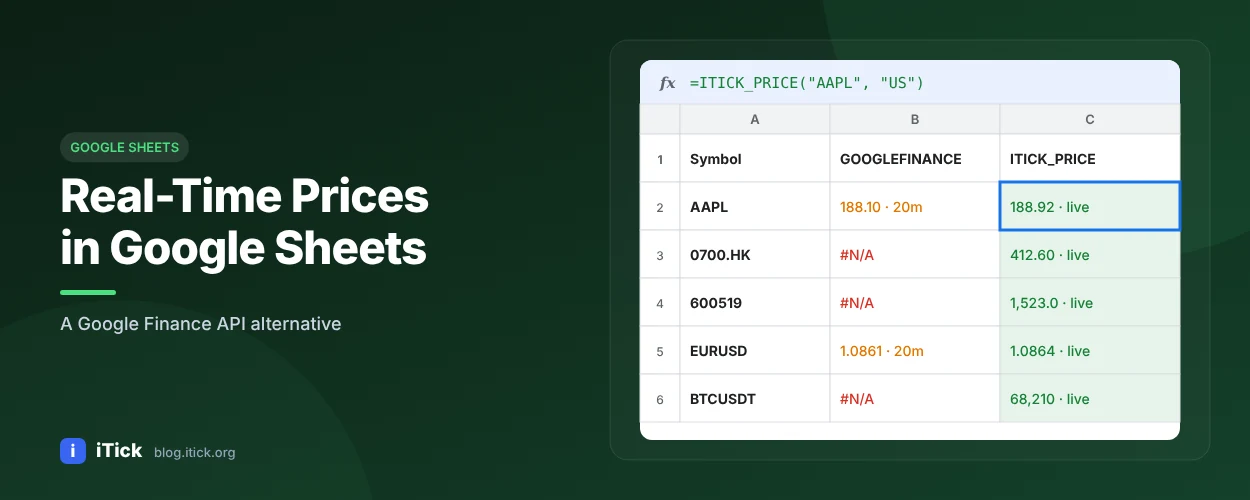
There is no official Google Finance API anymore, and GOOGLEFINANCE quotes may be delayed up to 20 minutes. Learn the GOOGLEFINANCE function limits and how to pull real-time stock, forex and crypto prices into Google Sheets with a 10-line Apps Script and the iTick API.
Market Data
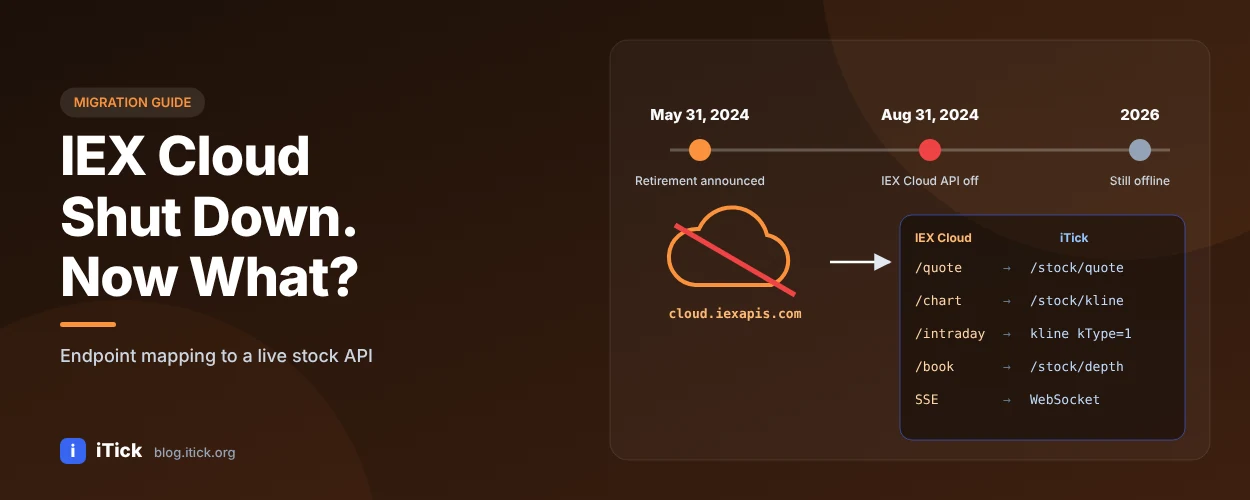
IEX Cloud was retired on August 31, 2024. What happened, what it means in 2026, and how to migrate quote, chart, intraday, order book and streaming calls to an IEX Cloud alternative such as the iTick stock API, with an endpoint mapping table and Python code.
Market Data
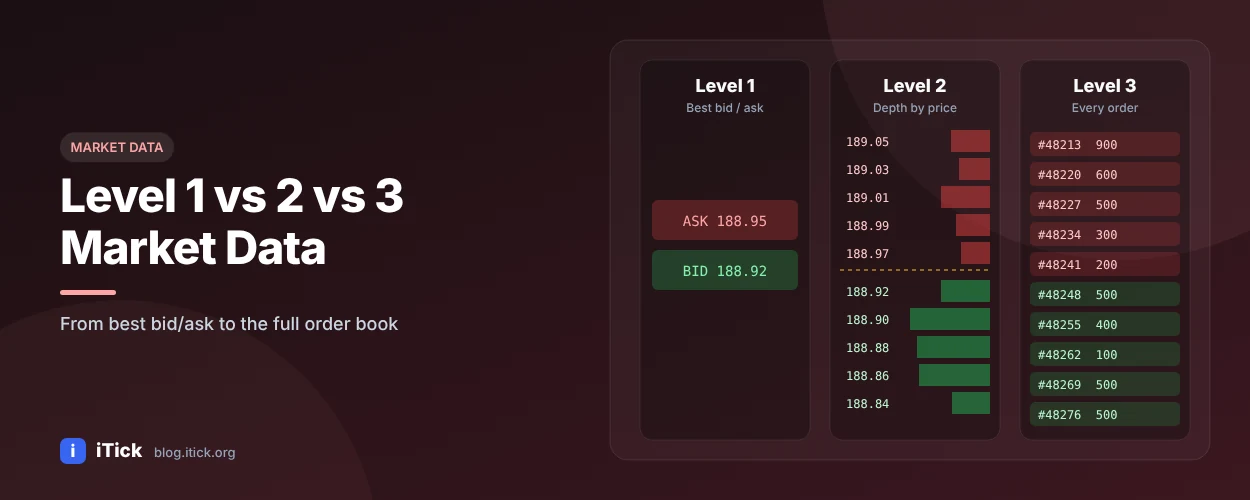
What is the difference between Level 1, Level 2 and Level 3 market data? Learn what each level contains, how to read a Level 2 order book, who needs which level, and how to get Level 2 depth data through an API.
Technical Analysis
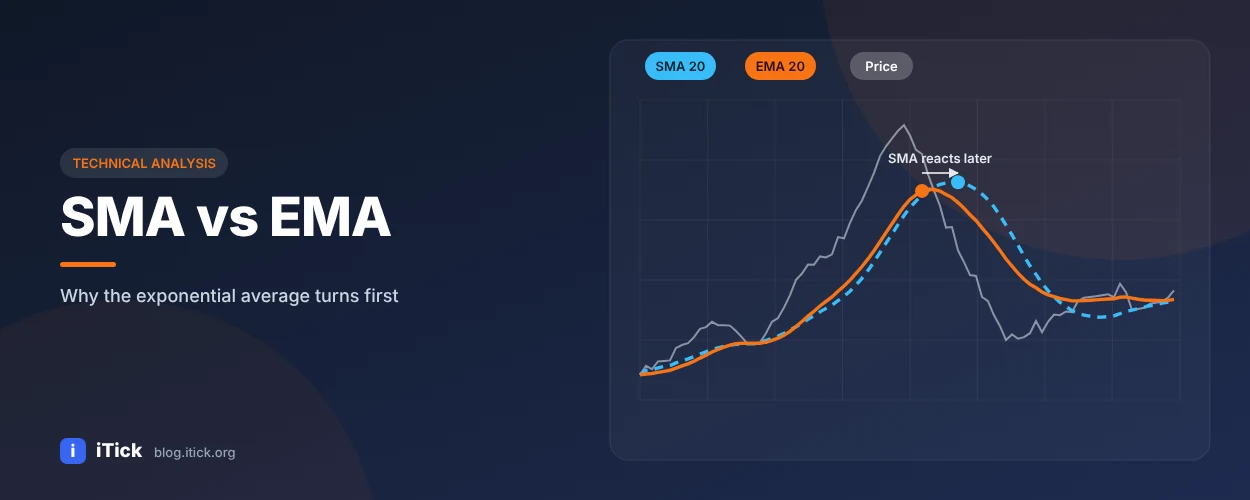
What is SMA in stocks and how is it different from EMA? Learn the simple moving average formula, SMA meaning, the key differences between SMA and EMA, when to use each, and how to calculate both in Python with iTick market data.
Technical Analysis
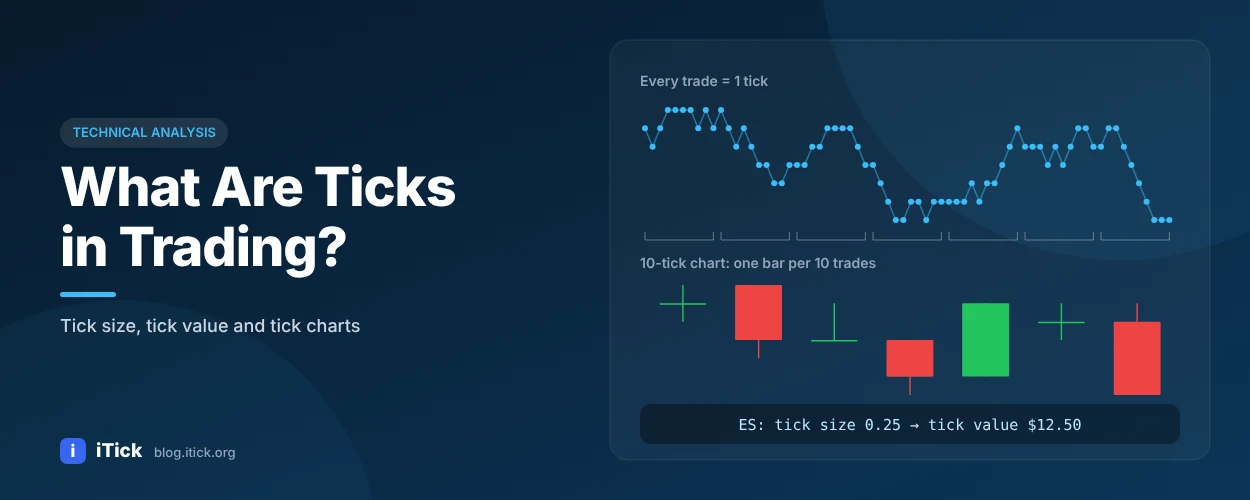
Ticks in trading explained: the two meanings of "tick", tick size vs tick value, how many ticks are in a point, how tick charts differ from time charts, and how to build a tick chart in Python from real-time tick data.
Market Data
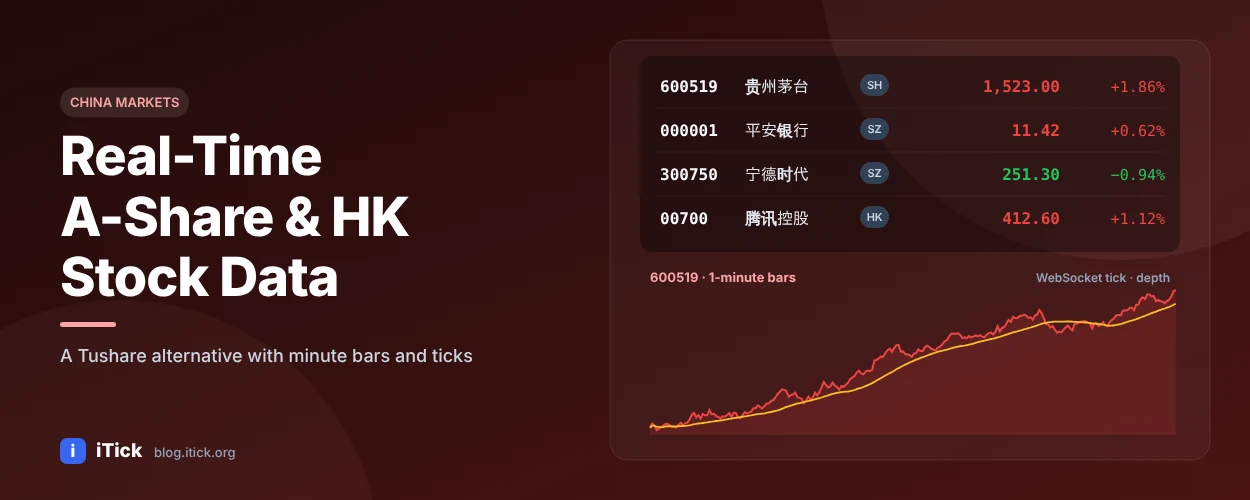
Tushare Pro is great for China market research, but access depends on a points system and minute data needs extra permission. Compare Tushare with iTick and get real-time A-share and Hong Kong quotes, minute bars, ticks and Level 2 depth in Python.
Market Data
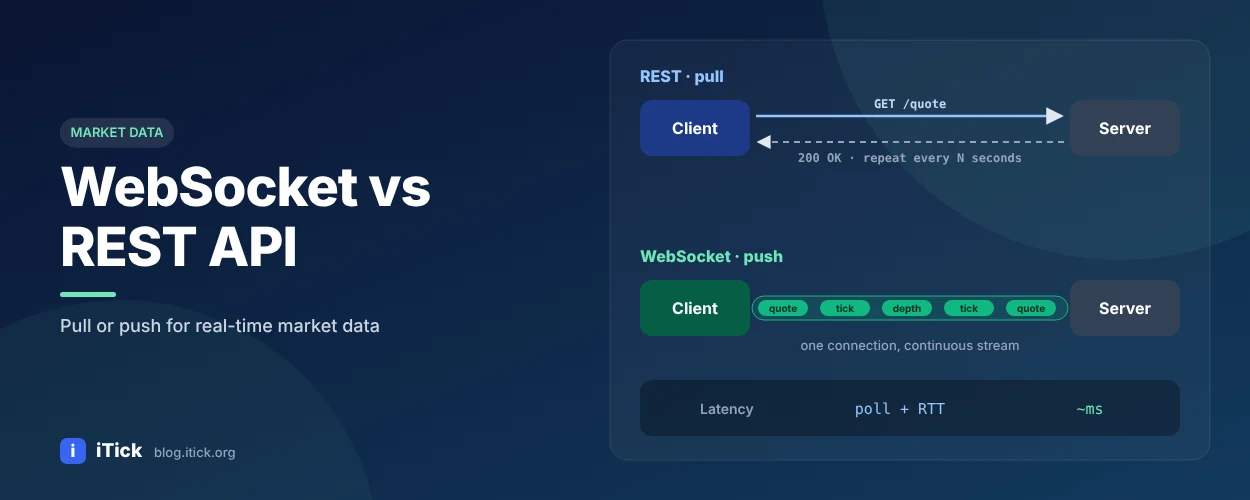
WebSocket vs REST explained for financial data: how each protocol works, latency and efficiency differences, when to use WebSocket streaming vs REST polling for stock, forex and crypto prices, and a hybrid architecture with Python examples.