What Is EMA? Exponential Moving Average Meaning, Formula and Python Example
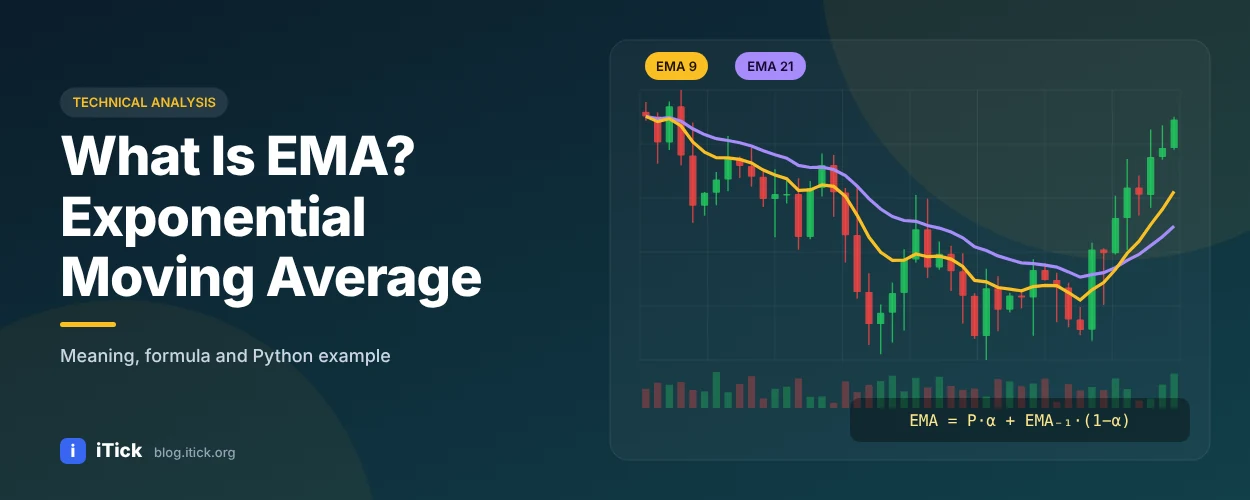
What Is EMA? Exponential Moving Average Meaning, Formula and Python Example
EMA stands for Exponential Moving Average. It is a trend-following indicator that smooths price data like a simple moving average (SMA), but gives more weight to the most recent prices. Because of that weighting, the EMA reacts faster when the market turns, which is why traders in stocks, forex, crypto and futures use it to spot trend direction, dynamic support and resistance, and crossover signals.
This guide explains the EMA meaning in plain language, walks through the exponential moving average formula step by step, and shows how to calculate EMA in Python using real OHLCV data from the iTick historical data API.
EMA meaning in trading
When traders say "price is above the 50 EMA", they mean the latest closing price is higher than the 50-period exponential moving average. The "period" is the number of bars used - 50 daily candles on a daily chart, 50 one-minute candles on a 1-minute chart.
In practice the EMA answers three questions:
- What is the trend? A rising EMA with price above it signals an uptrend; a falling EMA with price below it signals a downtrend.
- Where is dynamic support or resistance? In strong trends, pullbacks often stall near the 20 or 50 EMA.
- Is momentum changing? When a fast EMA (for example 12) crosses a slow EMA (for example 26), momentum is shifting. This is exactly how the MACD indicator is built.
The exponential moving average formula
The EMA is calculated recursively - each new value depends on the previous EMA:
      EMA_today = Price_today × α + EMA_yesterday × (1 − α)

α (smoothing factor) = 2 / (N + 1)
Where N is the number of periods. For a 10-period EMA, α = 2 / 11 ≈ 0.1818, meaning today's price contributes about 18% of the new EMA value, and the previous EMA contributes the remaining 82%.
The first EMA value needs a starting point. The common convention is to use the SMA of the first N closes as the seed, then apply the formula from bar N+1 onward.
Worked example (5-period EMA)
| Day | Close | Calculation | EMA(5) |
|---|---|---|---|
| 1-5 | 10, 11, 12, 11, 13 | SMA seed = 57 / 5 | 11.40 |
| 6 | 14 | 14 × 0.333 + 11.40 × 0.667 | 12.27 |
| 7 | 13 | 13 × 0.333 + 12.27 × 0.667 | 12.51 |
| 8 | 15 | 15 × 0.333 + 12.51 × 0.667 | 13.34 |
With N = 5, α = 2 / 6 = 0.333. Notice how the EMA moves toward each new price faster than a 5-day SMA would.
EMA vs SMA in one sentence
Both average the price, but the SMA weights every bar equally while the EMA weights recent bars more - so the EMA is faster and the SMA is smoother. We compare them in detail in SMA vs EMA: which moving average should you use?
Popular EMA periods and how traders use them
| EMA | Typical use |
|---|---|
| 9 EMA | Very short-term momentum, intraday scalping |
| 12 / 26 EMA | The two lines behind MACD; swing trading crossovers |
| 20 / 21 EMA | Short-term trend and pullback entries |
| 50 EMA | Medium-term trend filter |
| 200 EMA | Long-term trend; "above the 200 EMA" is often read as a bull market |
There is no "best" EMA. Shorter EMAs give earlier signals with more noise; longer EMAs give fewer, later, but more reliable signals. Match the period to your holding time and test it on historical data before trading.
Common EMA trading signals
- Price crossover: price closes above the EMA (bullish) or below it (bearish).
- EMA crossover: a fast EMA crosses above a slow EMA ("golden cross" style) or below it ("death cross" style). See our two moving average strategy tutorial.
- Slope filter: only take long trades when the 50 or 200 EMA is rising.
- Pullback entries: in a trend, buy dips that touch the 20 EMA and bounce.
Limitations
The EMA is a lagging indicator - it describes what has happened, not what will happen. In sideways, choppy markets EMA crossovers produce many false signals. Combine the EMA with a trend-strength filter such as the ADX indicator or with volume.
How to calculate EMA in Python with real market data
The fastest way to get reliable EMA values is to compute them yourself from clean OHLCV candles. The example below downloads daily bars for Apple from the iTick API and calculates the 12, 26 and 200 EMA with pandas.
      import requests
import pandas as pd

TOKEN = "YOUR_API_TOKEN"  # free key: https://itick.org/en/register

# kType = bar interval (see iTick docs for the full list)
url = "https://api.itick.org/stock/kline"
params = {"region": "US", "code": "AAPL", "kType": 8, "limit": 500}
headers = {"accept": "application/json", "token": TOKEN}

bars = requests.get(url, params=params, headers=headers, timeout=10).json()["data"]
df = pd.DataFrame(bars).rename(columns={"t": "time", "o": "open", "h": "high",
                                        "l": "low", "c": "close", "v": "volume"})
df["time"] = pd.to_datetime(df["time"], unit="ms")

# pandas ewm with span=N uses alpha = 2 / (N + 1) - the standard EMA formula
for n in (12, 26, 200):
    df[f"ema_{n}"] = df["close"].ewm(span=n, adjust=False).mean()

df["signal"] = (df["ema_12"] > df["ema_26"]).astype(int).diff()  # 1 = bullish cross, -1 = bearish
print(df[["time", "close", "ema_12", "ema_26", "ema_200", "signal"]].tail(10))
Swap stock for forex (region GB, code EURUSD) or crypto (region BA, code BTCUSDT) to calculate EMA on currency pairs or Bitcoin with exactly the same code.
Tip:
adjust=Falsereproduces the recursive formula used by most charting platforms. Withadjust=True, pandas uses a weighted-sum version that differs slightly on the first bars.
Updating EMA in real time
You don't need to recompute the whole series on every tick. Keep the last EMA value and update it with each new close:
      alpha = 2 / (12 + 1)
ema = ema + alpha * (new_close - ema)
Feed new_close from the iTick WebSocket market data feed and your EMA stays current with millisecond latency.
FAQ
What does EMA stand for? EMA stands for Exponential Moving Average, a moving average that gives more weight to recent prices.
What is a good EMA setting? Day traders often use 9 and 21 EMAs, swing traders 20 and 50, and long-term investors the 200 EMA. Backtest any setting on your market before relying on it.
Is EMA better than SMA? Neither is universally better. EMA reacts faster to new information; SMA is smoother and less prone to whipsaws.
Can I use EMA for crypto and forex? Yes. The EMA works on any time series of prices - stocks, indices, forex pairs, gold or cryptocurrencies.
Get the data behind your indicators
Every indicator is only as good as the data it is calculated from. iTick provides real-time and historical market data for stocks, forex, crypto, indices and futures through one REST and WebSocket API. Get a free API key and start calculating EMAs on real prices today.