ChanLun Strategy Backtesting with iTick Stock API
In financial market real-time quote APIs, investors are constantly seeking precise and efficient trading strategies. Chanlun, as a unique and powerful technical analysis theory, has attracted countless investors since its inception. Now, with rapid technological development, combining Chanlun with advanced real-time quote data and historical data brings unprecedented trading experiences to investors. This article will explore in depth how to use iTick real-time quote data and historical data to implement Chanlun-based strategy trading, helping you seize opportunities in the market.
Chanlun: The Wisdom Beacon of Market Investment
Chanlun, officially called "Mathematical Principles of Market Philosophy," was created by Chan Zhong Shuo Chan starting in 2006. It integrates multiple technical analysis methods including K-line theory, chaos theory, and MACD indicator analysis, using mathematical theory and complete classification methods as foundations to deeply analyze the changing patterns of securities market trends. The core of Chanlun lies in revealing the power balance and changing trends between bulls and bears through precise classification and analysis of price movements, thereby helping investors accurately grasp buy and sell points.
Chanlun's morphology studies the patterns and changing rules of market price movements, constructing a framework of market trends through identification and analysis of morphological structures such as fractals, strokes, segments, and pivots. Dynamics analyzes the dynamic changing patterns of market prices through concepts like divergence and interval nesting, helping investors determine precise positions for buy and sell points. This analytical approach combining morphology and dynamics gives Chanlun unique advantages in market analysis, providing investors with more comprehensive and accurate market information.
iTick: The Powerful Engine of Data-Driven Trading
In quantitative trading, data quality and timeliness are crucial. iTick, as a professional financial data provider, offers investors rich and accurate real-time quote data and historical data. iTick's real-time quote data allows investors to grasp market dynamics in real-time, promptly capture moments of price changes, and provide timely information support for trading decisions. Its historical data covers years of market conditions, providing sufficient data resources for investors to conduct strategy backtesting and optimization.
iTick's data features high frequency and high precision, meeting Chanlun's requirements for detailed data analysis. Whether studying short-term price fluctuations or grasping long-term trends, iTick's data provides strong support for investors. Additionally, iTick's data interface is simple and easy to use, facilitating investors' integration with their trading systems for rapid data acquisition and processing.
Combining Chanlun with iTick to Build Strategic Trading Systems
1. Data Acquisition and Processing
Using iTick's API interface, investors can easily obtain real-time quote data and historical data for stocks. Here's a Python code example for connecting to iTick API to get data:
      import requests
import json

# iTick API configuration
API_KEY = "your_api_key"
BASE_URL = "https://api.itick.org"
headers = {
        "accept": "application/json"
        "token": API_KEY
        }

def get_historical_data(symbol, region, endDate):
    """Get historical data"""
    url = f"{BASE_URL}/stock/kline"

    params = {
        "code": symbol,
        "region": region,
        "et":endDate,
        "kType":2,
        "limit":100
    }
    response = requests.get(url, params=params, headers=headers)
    data = json.loads(response.text)
    return data

def get_realtime_quote(symbol,region):
    """Get real-time quote data"""
    url = f"{BASE_URL}/stock/quote"
    params = {
        "region": region,
        "code": symbol
    }
    response = requests.get(url, params=params, headers=headers)
    data = json.loads(response.text)
    return data

# Example: Get historical data and real-time quotes for a stock
symbol = "AAPL"
region = "US"
historical_data = get_historical_data(symbol,region,1755098012000)
realtime_quote = get_realtime_quote(symbol,region)
After obtaining data, it needs to be cleaned and preprocessed to remove outliers and erroneous data, ensuring data accuracy and completeness. Additionally, according to Chanlun requirements, data should be adjusted for splits and dividends to more accurately reflect the stock's true price movements.
2. Trend Division and Pivot Determination
Based on processed data, using Chanlun's morphological methods, divide stock trends and identify basic morphological structures such as fractals, strokes, and segments. Here's a Python code example for identifying fractals:
      def find_fractals(data):
    """Identify top and bottom fractals"""
    fractals = []
    for i in range(2, len(data) - 2):
        # Top fractal: middle K-line high price higher than adjacent K-lines
        if data[i]['high'] > data[i-1]['high'] and data[i]['high'] > data[i-2]['high'] and data[i]['high'] > data[i+1]['high'] and data[i]['high'] > data[i+2]['high']:
            fractals.append({
                'index': i,
                'type': 'top',
                'price': data[i]['high']
            })
        # Bottom fractal: middle K-line low price lower than adjacent K-lines
        elif data[i]['low'] < data[i-1]['low'] and data[i]['low'] < data[i-2]['low'] and data[i]['low'] < data[i+1]['low'] and data[i]['low'] < data[i+2]['low']:
            fractals.append({
                'index': i,
                'type': 'bottom',
                'price': data[i]['low']
            })
    return fractals
Through analysis of these morphological structures, determine the position and range of trend pivots. Trend pivots are important bases for judging the balance of market bull-bear forces in Chanlun, and accurate pivot determination is crucial for subsequent buy-sell point judgment.
3. Divergence Judgment and Buy-Sell Point Determination
After determining trend pivots, use Chanlun's dynamic methods to compare the strength of two trend segments and judge whether divergence occurs. Here's a Python code example for judging divergence:
      import numpy as np

def calculate_force(data, start, end):
    """Calculate the strength of a trend segment"""
    # Simplified processing here, can calculate based on MACD and other indicators
    prices = [d['close'] for d in data[start:end+1]]
    return np.abs(np.diff(prices)).sum()

def judge_divergence(data, segment1_start, segment1_end, segment2_start, segment2_end):
    """Judge whether two trend segments show divergence"""
    force1 = calculate_force(data, segment1_start, segment1_end)
    force2 = calculate_force(data, segment2_start, segment2_end)
    # Price makes new high/low but strength weakens, divergence occurs
    price1_high = max([d['high'] for d in data[segment1_start:segment1_end+1]])
    price2_high = max([d['high'] for d in data[segment2_start:segment2_end+1]])
    if price2_high > price1_high and force2 < force1:
        return 'top_divergence'  # Top divergence
    price1_low = min([d['low'] for d in data[segment1_start:segment1_end+1]])
    price2_low = min([d['low'] for d in data[segment2_start:segment2_end+1]])
    if price2_low < price1_low and force2 < force1:
        return 'bottom_divergence'  # Bottom divergence
    return None
Divergence is a key signal for judging trend reversals in Chanlun. When divergence occurs, it often means market trends are about to change, and investors can determine buy-sell points accordingly. Combined with iTick's real-time quote data, investors can promptly capture divergence signals and make quick trading decisions.
4. Strategy Backtesting and Optimization
Using historical data provided by iTick, backtest trading strategies built based on Chanlun. Through backtesting, evaluate strategy performance over past periods, including return rate, win rate, maximum drawdown, and other indicators. Based on backtesting results, optimize strategy parameters such as adjusting MACD indicator parameters and buy-sell point thresholds to improve strategy profitability and stability.
5. Live Trading and Risk Management
Deploy optimized strategies to live trading systems, using iTick's real-time quote data to achieve automated trading. During live trading, set reasonable stop-loss and take-profit points to strictly control risks. Meanwhile, closely monitor market dynamics and adjust strategies timely according to market environment changes to ensure smooth trading.
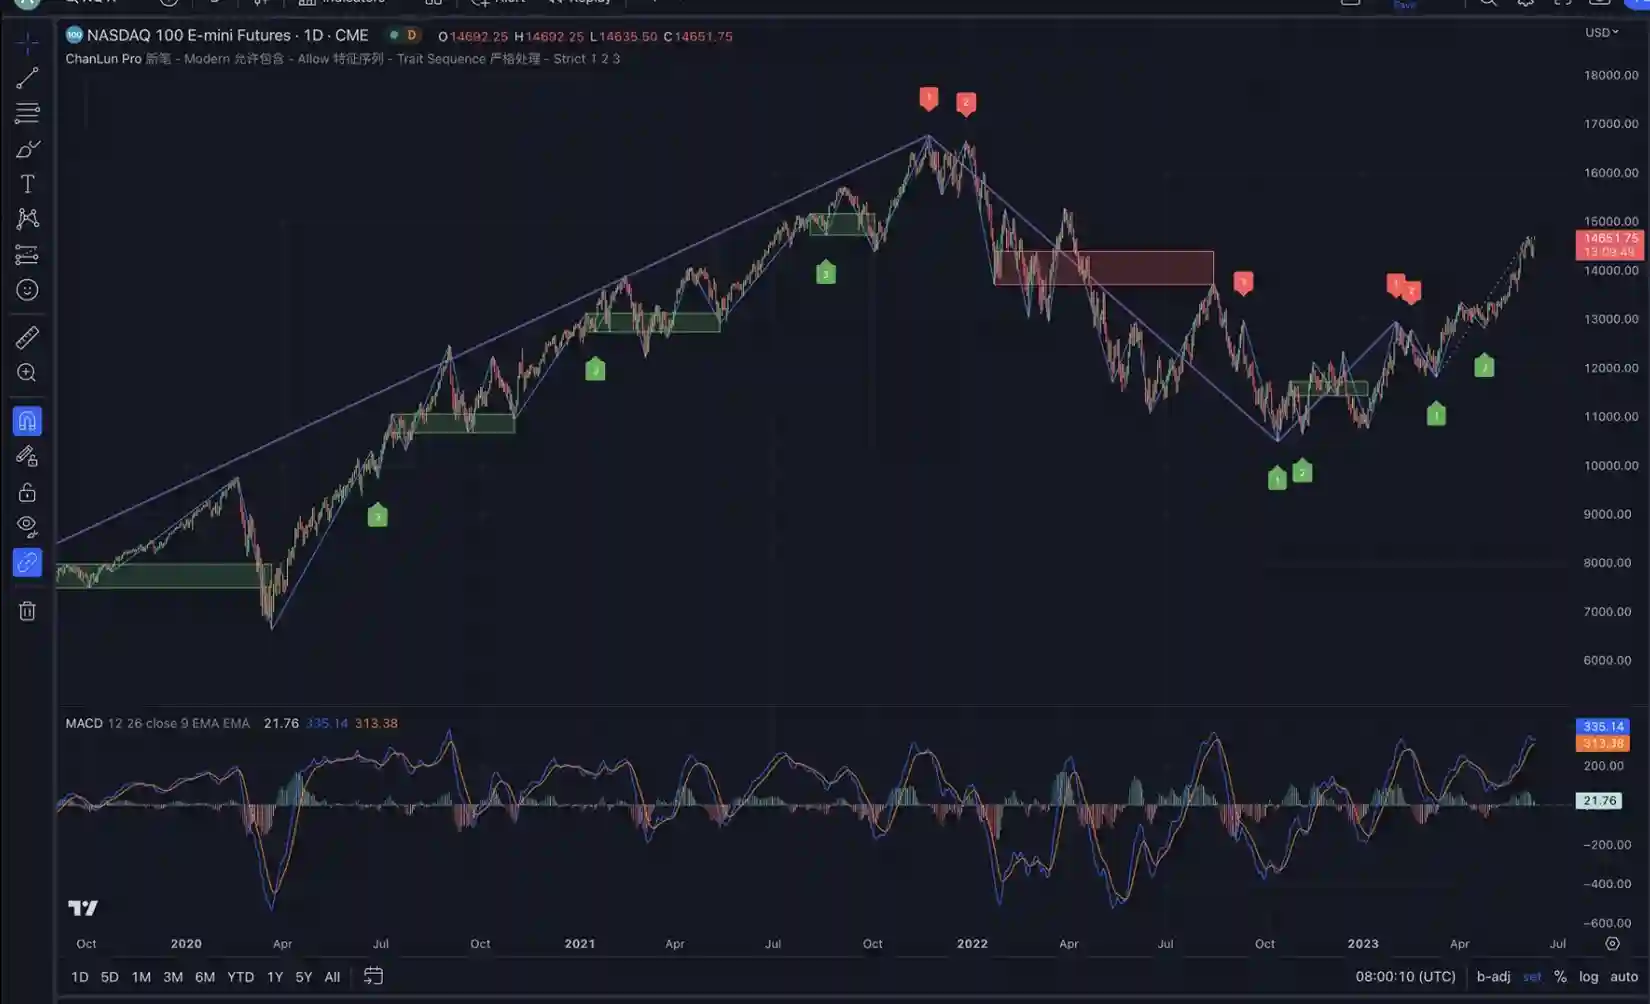
Practical Case Analysis
To more intuitively demonstrate the strategic trading effects of combining Chanlun with iTick, let's look at a practical case. Taking a certain stock as an example, obtain its historical data and real-time quote data through iTick, and analyze using the above Chanlun-related code. During a certain period, through trend division and pivot determination, clear divergence was found in the stock. According to Chanlun's buy-sell point judgment rules, a buy signal was issued timely. In subsequent market movements, the stock price indeed rose, and investors successfully achieved profits.
Through backtesting historical data of multiple stocks, strategies combining Chanlun with iTick achieved significant returns over the past few years, with win rates and return rates both superior to market averages. This fully proves the effectiveness and feasibility of this strategic trading approach.
Conclusion
The combination of Chanlun with iTick's real-time quote data and historical data provides investors with a new strategic trading approach. Through precise market analysis and timely trading decisions, plus practically implementable code, investors can grasp more investment opportunities in complex and volatile financial markets, achieving steady asset appreciation. If you're still troubled by finding an effective trading strategy, try combining Chanlun with iTick data to start your new era of strategic trading!