What Are Ticks in Trading? Tick Size, Tick Value and Tick Charts Explained
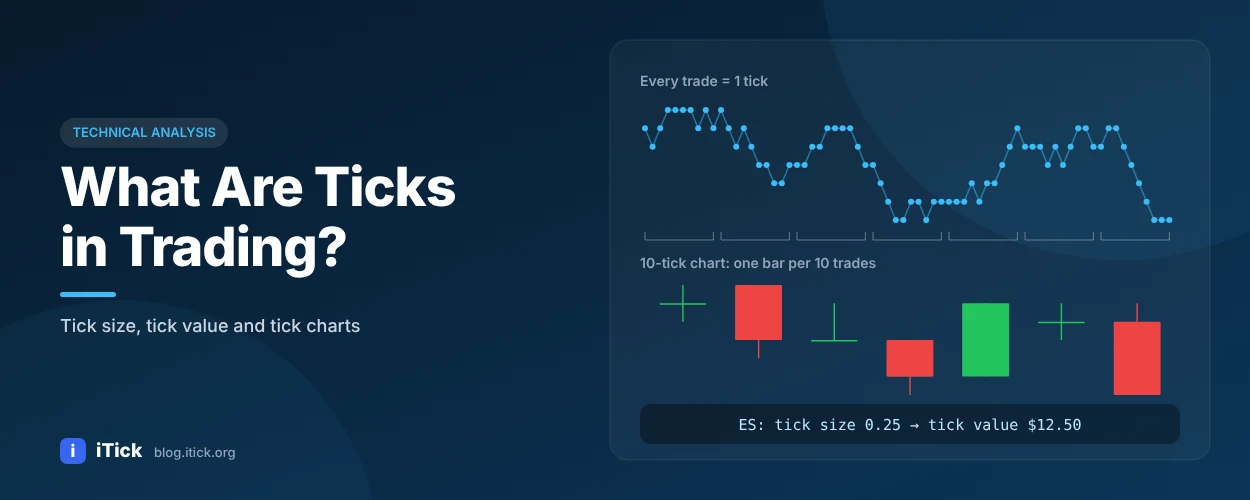
What Are Ticks in Trading? Tick Size, Tick Value and Tick Charts Explained
"Tick" is one of the most used - and most confusing - words in trading. Depending on context it can mean the smallest possible price move, or a single trade printed on the tape. Both meanings matter, and both lead to one of the most popular chart types among day traders: the tick chart.
Two meanings of "tick"
1. A tick as a price increment. Every exchange defines a minimum price change for each instrument, called the tick size. A stock might move in $0.01 steps, while an E-mini S&P 500 futures contract moves in 0.25 index-point steps.
2. A tick as a trade (or quote update). In market data, a "tick" is one event - a single transaction with its price, size and timestamp. A stream of these events is called tick data or tick-by-tick data. We cover it in depth in Tick Data Explained.
Tick size and tick value
- Tick size = the minimum price increment.
- Tick value = how much money one tick is worth for one contract or lot.
Tick value = Tick size × Contract multiplier
| Instrument | Tick size | Multiplier | Tick value |
|---|---|---|---|
| E-mini S&P 500 (ES) | 0.25 points | $50 per point | $12.50 |
| Micro E-mini S&P 500 (MES) | 0.25 points | $5 per point | $1.25 |
| Crude oil (CL) | $0.01 per barrel | 1,000 barrels | $10.00 |
| Gold (GC) | $0.10 per ounce | 100 ounces | $10.00 |
| US stock | $0.01 | 1 share | $0.01 per share |
Contract specifications can change - always confirm them with the exchange before trading.
How many ticks are in a point?
Divide one point by the tick size:
Ticks per point = 1 / Tick size
For ES futures, 1 / 0.25 = 4 ticks per point. For crude oil, a $1.00 move equals 100 ticks. In forex, traders usually talk in pips instead (0.0001 for most pairs), and many brokers quote a fractional "pipette" (0.00001) as the smallest tick.
What is a tick chart?
A tick chart draws a new bar after a fixed number of trades, not after a fixed amount of time. On a 233-tick chart, each candle contains exactly 233 transactions.
| Time chart (e.g. 5-minute) | Tick chart (e.g. 233-tick) | |
|---|---|---|
| New bar when | 5 minutes pass | 233 trades occur |
| Busy market | Few bars, each packed with activity | Many bars - more detail |
| Quiet market | Many flat, low-information bars | Few bars - less noise |
| Best for | All styles, multi-timeframe analysis | Active intraday trading, scalping |
Because tick charts expand when activity is high and compress when it is low, they show where real trading happened. Popular settings include 133, 233, 512 and 1,000 ticks - the specific number matters less than consistency.
Pros and cons
Pros: filters out quiet periods, reveals momentum bursts early, useful for scalping and order-flow analysis. Cons: requires true tick-by-tick data, not meaningful for instruments with low trade counts, and harder to compare across markets.
Build a tick chart in Python from live ticks
To build tick charts you need every trade. iTick's tick data API streams tick-by-tick trades over WebSocket. The script below aggregates every 100 ticks into one OHLCV bar.
      import json
import websocket  # pip install websocket-client

TOKEN = "YOUR_API_TOKEN"
TICKS_PER_BAR = 100
bar, count = None, 0

def on_open(ws):
    ws.send(json.dumps({"ac": "subscribe", "params": "AAPL$US", "types": "tick"}))

def on_message(ws, message):
    global bar, count
    msg = json.loads(message)
    if msg.get("data", {}).get("type") != "tick":
        return
    t = msg["data"]
    price, size = float(t["ld"]), float(t.get("v", 0))  # field names: see iTick WebSocket docs
    if bar is None:
        bar = {"open": price, "high": price, "low": price, "close": price, "volume": 0}
    bar["high"] = max(bar["high"], price)
    bar["low"] = min(bar["low"], price)
    bar["close"] = price
    bar["volume"] += size
    count += 1
    if count == TICKS_PER_BAR:
        print("new tick bar:", bar)
        bar, count = None, 0

ws = websocket.WebSocketApp("wss://api.itick.org/stock", header={"token": TOKEN},
                            on_open=on_open, on_message=on_message)
ws.run_forever(ping_interval=20)
Check the message field names in the iTick WebSocket documentation for your asset class; the aggregation logic stays the same for stocks, futures and crypto.
FAQ
What does 1 tick mean in trading? It is either the smallest price change allowed for an instrument, or one individual trade in the market data stream.
How many ticks are in a point on ES? Four - the tick size is 0.25 points.
Is a tick the same as a pip? Not exactly. A pip is the conventional unit in forex (usually 0.0001); the tick is the smallest increment the venue allows, which can be smaller.
Which is better, tick charts or time charts? Tick charts suit active intraday traders in liquid markets; time charts are universal and better for multi-timeframe analysis.
Get tick-by-tick data
Tick charts are only as accurate as the tick feed behind them. iTick delivers tick-by-tick trades and Level 2 depth for stocks, futures, forex and crypto with millisecond latency. Start free.