How to Get Live Stock Market Data in Excel
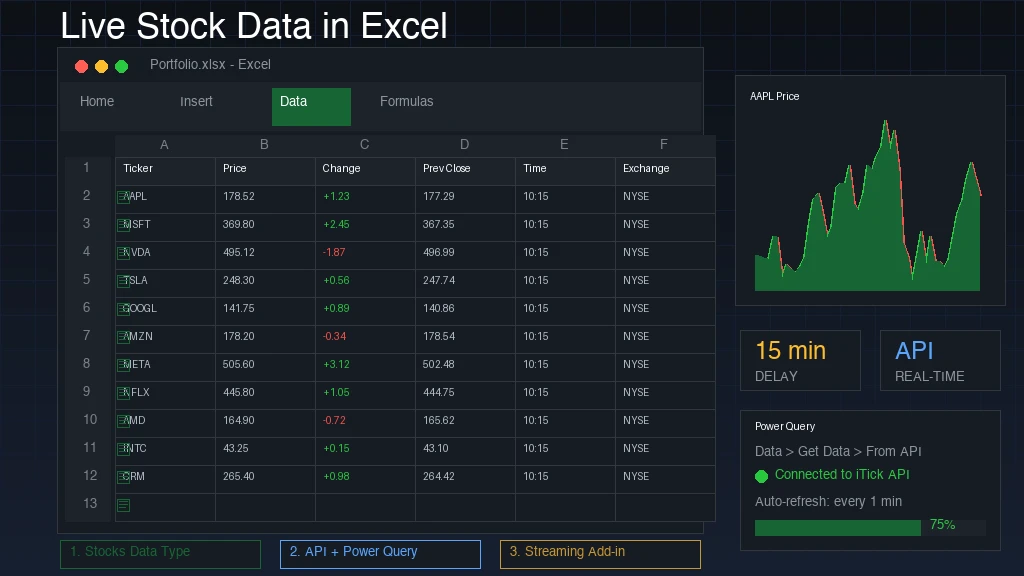
The fastest way to get stock market live data to Excel is the built-in Stocks data type. Type your tickers into a table, click Data > Stocks, add a Price column, and refresh. It takes about two minutes, but prices are delayed by 15 minutes or more on most exchanges. If you need fresher quotes, load them from a market data API with Power Query, or install a streaming add-in.
The problem is that Excel does not stream anything by itself. Prices change only when a refresh runs, the Stocks button is missing on some installations, and copying quotes from a web page breaks the moment the layout changes. Many people end up pasting prices by hand, which defeats the point of a live sheet.
This guide walks through four steps: converting tickers, adding and refreshing price fields, pulling prices from an API, and choosing the method that fits your work. iTick is a market data API provider, so you will see where an API beats the built-in feature and where it does not.
What live means in Excel and what you need
Excel shows live data by refreshing from a source, not by streaming ticks. Knowing the delay and the requirements before you build saves you from debugging a sheet that was never going to be real time.
Live in Excel means refreshed, not streamed
The built-in feature gets its prices from LSEG Data & Analytics, and Microsoft applies a delay that depends on the exchange. The table shows a sample from Microsoft's list of supported exchanges and delay times.
| Exchange | Delay (minutes) |
|---|---|
| Nasdaq Last Sale | 0 |
| Cboe BZX Exchange | 0 |
| National Stock Exchange of India | 5 |
| New York Stock Exchange | 15 |
| Nasdaq Stock Market | 15 |
| London Stock Exchange | 15 |
| Hong Kong Exchanges | 15 |
| Toronto Stock Exchange | 20 |
| Shenzhen Stock Exchange | 30 |
A New York Stock Exchange quote you read at 10:30 a.m. Eastern reflects the market at about 10:15. Microsoft also states that this data is not intended for trading purposes.
Excel refreshes, it does not stream, so treat every built-in price as a delayed snapshot.
What you need before you start
Check these items first. A missing one is the usual reason the Stocks button does not appear.
- A Microsoft 365 account, or a free Microsoft account, as Microsoft requires for the Stocks data type.
- An editing language of English, French, German, Italian, Spanish, or Portuguese in your Office language preferences.
- An internet connection, because every refresh calls an online source.
- For the API method, an API key and a current Excel version with Power Query under Data > Get Data.
Step 1. Convert tickers to the Stocks data type
Typing a ticker and clicking Data > Stocks turns plain text into a linked record that Excel can query. Do this in a table so new rows pick up the formatting and formulas automatically.
Set up the table
- Type Ticker in cell A1, then AAPL, MSFT, and NVDA in A2 to A4.
- Select A1:A4 and choose Insert > Table. Tick "My table has headers."
- Select the ticker cells, open the Data tab, and click Stocks.
- Look for the small building icon in each cell. It means Excel matched your text to a company.
The conversion works for company and fund names too, but tickers are the least ambiguous input. If a symbol trades on several exchanges, prefix it with the exchange code from Microsoft's table, such as XLON:VOD.
Convert tickers inside an Excel table, because every later step gets easier.
Fix cells that show a question mark
A question mark means Excel could not match your text. Correct any typo and press Enter, and Excel retries the lookup. If it still fails, click the question mark to open the selector pane, search by keyword, pick the right match, and click Select.
Step 2. Add price fields and keep them fresh
With the cells converted, you add fields as columns and then control when they refresh. Prices update only when a refresh runs, so this step decides how current your sheet feels.
Add Price, Change, and other columns
Select a converted cell and click the Add Column button that appears. Choose Price, then repeat for Change, Previous Close, Last Trade Time, or Exchange. In a table you can also type a field name such as Change into the header row and the column fills itself.
You can also write formulas. If A2 holds a converted ticker, =A2.Price returns its price, and =FIELDVALUE(A2,"Price") does the same. Press Ctrl+Shift+F5 on a cell to list every field available. For a portfolio, add a Shares column and a Value column. If Price shows 200 and Shares shows 50, Value (Price times Shares) returns 10,000.
Refresh the data on demand or on a timer
Click Data > Refresh All, or right-click a converted cell and choose Data Type > Refresh. The same menu has Refresh Settings, where you can refresh when the file opens or on a timer.
Past prices come from a different function. This formula returns 30 days of dates and closing prices:
=STOCKHISTORY("MSFT",TODAY()-30,TODAY(),0,1,0,1)
STOCKHISTORY gives you history, while the Stocks data type gives you the latest delayed quote.
Step 3. Pull real-time prices from an API with Power Query
When delayed quotes are not enough, or your market is missing from Microsoft's list, an API is the next option. Power Query can call a REST endpoint, read the JSON, and load it into a sheet that refreshes on a schedule.
Load JSON into a worksheet
Get your API key and the quote endpoint from your provider's documentation. For iTick, which covers stocks, forex, and crypto plus Hong Kong and China A-share markets, copy the endpoint and the authentication header name from the iTick docs. Then follow these steps:
- Go to Data > Get Data > From Other Sources > Blank Query.
- Open Advanced Editor and paste the template below.
- Replace the three placeholders with your endpoint, header name, and key.
- Click Done, expand any nested records with the arrow icons, and choose Close & Load.
      let
    ApiUrl = "PASTE_QUOTE_ENDPOINT_URL_HERE",
    ApiKey = "PASTE_YOUR_API_KEY_HERE",
    Source = Json.Document(Web.Contents(ApiUrl, [Headers = [#"HEADER_NAME_FROM_DOCS" = ApiKey]])),
    AsTable = Record.ToTable(Source)
in
    AsTable
If Excel asks for credentials, choose Anonymous, because the key already travels in the header.
Schedule the refresh and know its limit
Open Data > Queries & Connections, right-click your query, choose Properties, and tick Refresh every with a number of minutes. Set 1 minute and you make 390 requests over a 6.5-hour US session, so check that against your plan's rate limit.
Each refresh is one REST call, which makes this polling, not streaming. True tick-by-tick updates need a WebSocket connection, which Excel cannot open natively. iTick offers both REST and WebSocket, so a small script or add-in can handle the stream while Excel reads the results.
Power Query polls an API as often as every minute, and WebSocket streaming needs something outside plain Excel.
Step 4. Pick the method that fits your job
Choose by how fresh the prices must be and which markets you track. The built-in feature wins on simplicity, an API wins on freshness and coverage, and add-ins sit between them.
Compare the three methods
| Method | Rough setup time | Update speed | Best for |
|---|---|---|---|
| Stocks data type | 2 minutes | Manual or timed refresh, delayed on most exchanges | Personal watchlists and simple portfolios |
| API with Power Query | 15 to 30 minutes | Timed refresh, as often as every minute | Dashboards, forex, crypto, Hong Kong and A-share data |
| Third-party add-in | Install and sign in | Streaming, depending on the vendor | Traders who want a stream without writing code |
When an API is the better route
Stay with the Stocks data type if you follow a few large US companies and a 15-minute delay does not hurt. Move to an API when you track forex, crypto, or Asian markets, want minute bars or Level 2 depth, or need the same data in Python for backtesting. The code above is a starting point, and you can reuse the same endpoints in scripts later.
If a 15-minute delay breaks your workflow, stop tuning the built-in feature and switch to an API.
Start with the built-in feature, then add an API
For a quick watchlist, convert your tickers to the Stocks data type, add Price and Change columns, and set a refresh interval. For fresher or broader data, load an API into Power Query and schedule the refresh, keeping rate limits in mind. Add-ins fill the gap when you want streaming without code.
Whichever route you take, remember that Excel refreshes and does not stream, and that built-in prices are delayed. If you want to go further with real-time quotes, minute bars, and Python examples, explore the iTick blog for tutorials built around market data APIs.